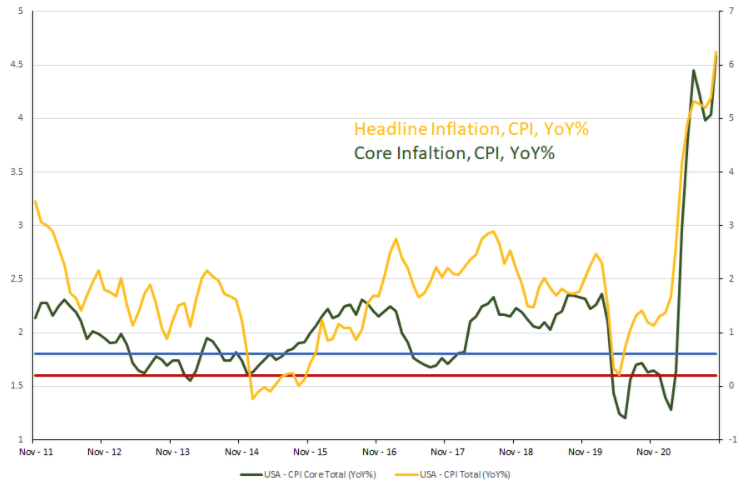
This chart shows the rapid increase in inflation as the economy has reopened.
Editor’s Note: As Edward Jones is the financial advisor of this daily online publication, permission has been granted to pillartopost.org [p2p] to republish certain data to our readership.
GUEST BLOG / By Mona Mahajan, Investment Strategist, Edward Jones Company--This week, we continued to see signals that inflation in the U.S. remains hot, with both the producer price index (PPI) and consumer price index (CPI) coming in above expectations, now at multidecade highs.
The headline CPI reading came in at 6.2% year-over-year, the highest level since 1990, while the PPI reading was 8.6%, the highest on record since 2010. This was driven by what we consider more transitory factors, including areas like energy and auto prices, as well as stickier components of inflation, like rent and wages.
What is behind higher prices? Inflation has remained elevated - with core CPI above 2.0% -- for nearly eight months now, since April of 2021, when the economy was reopening and vaccines were becoming more prevalent. Keep in mind that in the 10 years prior to the pandemic, average CPI was 1.6% and average core CPI was 1.8%, well below the latest CPI reading of 6.2% and core reading of 4.6%. Mona Mahajan

What is driving this elevated inflation? We believe the combination of strong demand and soft supply, caused by supply-chain bottlenecks, slow global reopening and labor shortages, and commodity-price inflation, have created imbalances, pushing up prices.
In turn, these imbalances have shown up for consumers as higher prices at the gas pump and increased costs for groceries and apparel, putting some pressure on consumption broadly.
What could help ease inflationary pressure? While elevated inflation can be a drag on consumption and growth, our view remains that inflation will moderate, perhaps by the middle of next year, but will likely remain elevated versus pre-pandemic averages.
How could inflation come down from here? There are components of inflation we consider more transitory that will likely come back down, while there are some we see as stickier that may remain elevated. The Federal Reserve itself has conducted a study outlining both the "flexible" and "sticky" parts of inflation.
Transitory parts of inflation: The components that are more transitory include areas like prices for energy and gas, automobiles, and food and lodging. Sectors like these have been battling the triple whammy of supply-chain disruptions, labor shortages, and higher demand as the pandemic eases globally.
However, keep in mind that the surge in prices we have seen this year will likely not repeat in the months ahead. In fact, annual comparisons will start getting tougher as we head toward April of next year. We also may start to see supply-chain disruptions ease in the new year. Already we are starting to see early indications of this, as several auto companies have commented on improving supply conditions in their quarterly earnings commentary.
Stickier components: On the other hand, there are components of inflation that may remain elevated. The largest parts of this sticky basket include areas like shelter and rent costs, medical care services, and education costs. We would also include wage inflation, which tends to be sticky because salary increases are generally difficult to reverse once implemented.
While these may moderate- particularly as the labor market normalizes - we may see stickier parts of inflation remain above average for longer. What does this mean for Fed rate hikes? After years of trying to bring inflation up to its 2.0% target, the Federal Reserve now faces a new challenge: how to keep inflation contained.
For the Fed, elevated inflation is worrisome because it could mean they are "behind the curve" in battling inflation and therefore need to raise rates. Markets now seem to be pricing in two rate hikes next year, and, after this week's inflation readings, some are even expecting three.
However, we continue to believe that this Fed will be deliberate and patient with rate-hiking and will not want to derail any economic momentum.
Fed Chair Powell reiterated in his latest comments that inflation is "expected to be transitory," and the Fed's current dot plot indicates just one rate hike in 2022, for now. The FOMC also has the benefit of time, as it has committed to the tapering process, likely through June of 2022, before considering rate hikes. During this time, it can evaluate the direction of inflation and labor markets and then move accordingly.
Keep in mind, it is not only when the Fed starts to raise rates, but also how many times it hikes them. We believe that this rate-hiking cycle will likely be shallower than those in the past, perhaps bringing the federal funds rate to 1.5% - 2.0% (versus 4.25% and 2.25% the last two cycles), making rates more palatable for markets and the economy broadly. Portfolio positioning in inflationary environments
From a market perspective, how can investors think about protecting their portfolios from rising or elevated inflation? In our view, one of the best hedges to inflationary pressures is to invest in equities, which tend to outpace the rate of inflation over time. Consider this year, for example: While inflation is up 6.2% year-over-year, the S&P 500 is up 23.8%. Equity returns hold up well in inflationary environments, and can outperform when inflation comes down:
Source: FactSet, Past results are not a guarantee of future returns, the S&P 500 is an unmanaged index and cannot be invested indirectly. This chart illustrates how equities tend to be a good long-term inflation hedge.
In a rising inflation and rising-rate environment, value and cyclical parts of the market tend to outperform, including sectors like financials, energy and industrials. We continue to support an overweight position to value investments broadly. Also, companies that can pass along higher prices to consumers, rather than absorb costs, can hold up better.
This includes sectors like consumer staples, utilities, and health care, which have all lagged the broader market this year and may have some opportunities for a catch-up. Other assets that can do well in periods of inflation include shorter-duration fixed income; commodities, including precious metals like gold; and emerging markets, especially those economies that are commodity or energy producers.
Keep in mind, however, that inflation readings are backward-looking, and if we believe inflationary pressures will ease in the months ahead, markets will tend to price this in ahead of time. Indeed, bond markets tend to lead performance as inflation starts to come down. Thus, we broadly advocate owning a diversified portfolio, with some exposure to assets that can perform in inflationary environments.
Longer-term, deflationary factors may be at play. Finally, when we think about inflationary pressures over the longer term - 10 years or beyond - there are some long-term factors that may be putting downward pressure on inflation:
--Aging demographic: The U.S., like many developed economies, has a population that is aging, where the working-age population is expected to shrink. This is putting downward pressure on consumption and inflation broadly.
--Rise in automation: As technology advances and automation comes more to the forefront, many parts of the workforce may be replaced or supplemented with automation. This can keep wage inflation down and inflationary pressures contained. --Globalization: A more global workforce means companies can source labor and parts from around the world, at lower prices if needed. This broadly helps keep inflation contained.
However, lately the trend has perhaps been moving away from globalization, and this is something we are monitoring, as it can have inflationary impacts as well. Overall, while the near-term cyclical trend may point to higher (but perhaps moderating) inflation, we would expect inflation to ease and perhaps be more contained, especially given the longer-term forces at play.
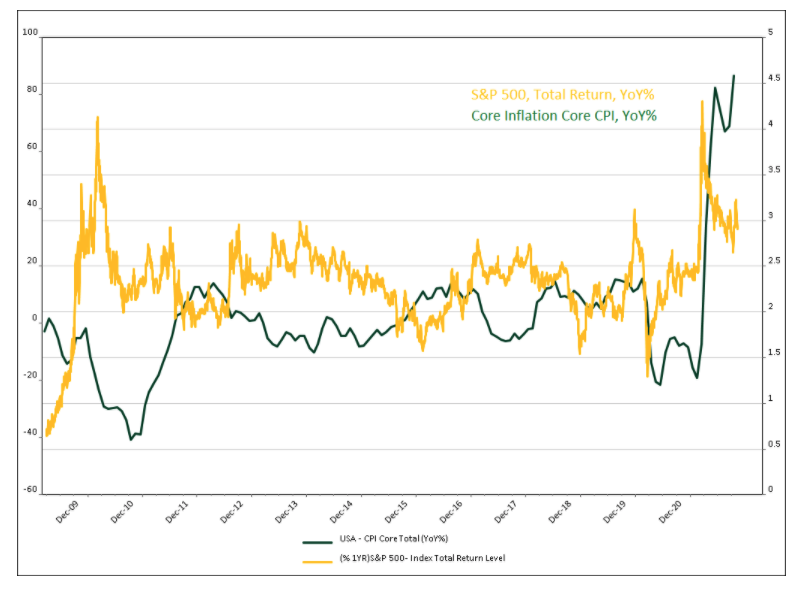 |
| This chart illustrates how equities tend to be a good long-term inflation hedge. |
No comments:
Post a Comment